
The M25 remains essential to businesses operating across South East England, but new traffic analysis has highlighted how congestion and unpredictable journey times can affect van operators, deliveries and day-to-day business costs.
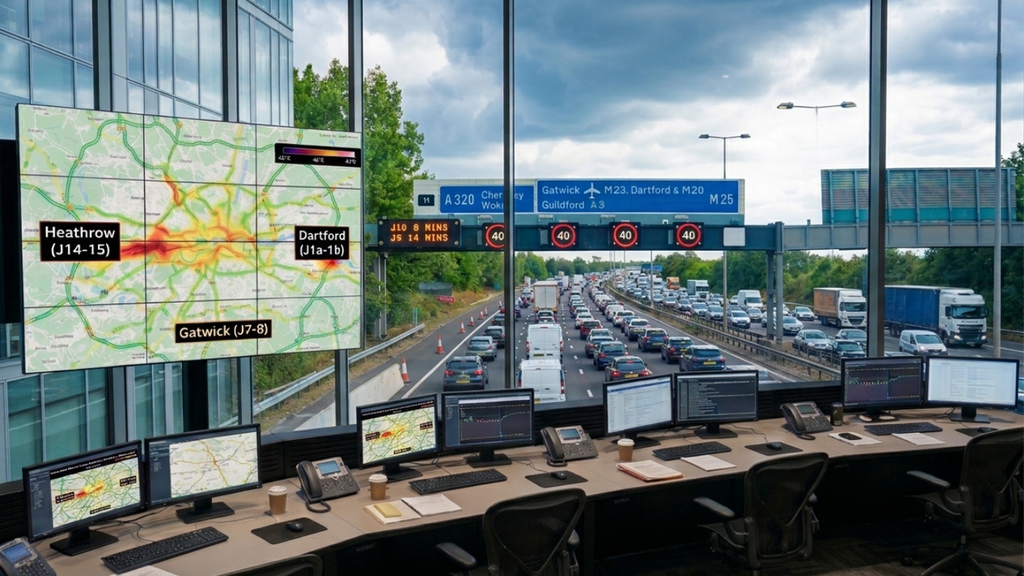
Research from Geotab, published as the motorway marks 40 years since it fully opened, identifies the western section between Junctions 10 and 20 as a particular congestion hotspot. The findings suggest that journey-time reliability, rather than consistently slow traffic across the entire motorway, is a significant challenge for businesses relying on the route.
For companies using cars and vans to reach customers, transport goods or attend appointments, delays can disrupt schedules, increase fuel consumption and reduce the number of jobs drivers can complete during a working day. These pressures also make effective fleet lifecycle management important when reviewing vehicle use, replacement planning and long-term operating requirements.

M25 Congestion Is Concentrated Around Key Junctions
Geotab analysed connected-vehicle data across 58 directional sections of the M25, using 12 sample weeks between September 2025 and August 2026.
The analysis found that the eight most congested sections were all located between Junctions 10 and 20, around the motorway’s connections with the M3, M4 and M40 corridors.
The worst-performing section was Junction 12 to Junction 11 anticlockwise, between Thorpe and Chertsey, where traffic travelled at an average of 68% of the posted speed limit.
The Heathrow corridor also featured prominently, with congestion affecting traffic in both directions.
| M25 section | Direction | Key finding |
|---|---|---|
| Junction 12 to Junction 11 | Anticlockwise | Worst congestion overall, averaging 68% of the posted speed limit |
| Junction 15 to Junction 16 | Clockwise | Average speed equivalent to 70% of the posted speed limit |
| Junction 15 to Junction 16 | Anticlockwise | Average speed equivalent to 72% of the posted speed limit |
| Junction 14 to Junction 15 | Clockwise | Average speed of 44.6 mph |
Source: Geotab analysis of connected-vehicle data.
However, the figures do not suggest that every section of the M25 is consistently congested. Geotab found that 46 of the 58 directional sections operated at 80% or more of their posted speed limit on average.
For fleet operators, this distinction matters. The greatest difficulty may arise when a normally manageable journey becomes unpredictable, leaving drivers and businesses with little time to adjust their plans.
Unpredictable Journey Times Put Pressure On Businesses
The research highlights how significantly journey times can change depending on when drivers travel.
On the clockwise stretch between Junctions 14 and 15, a journey taking 9.2 minutes at 4pm can fall to just three minutes at 7pm. On Junction 17 to Junction 16 anticlockwise, a journey taking 15.6 minutes at 7am drops to 6.6 minutes at 7pm.
These differences demonstrate why journey planning based on distance alone may not provide a realistic picture of how long a business trip will take.
The impact can extend beyond the time spent in traffic. Delays can affect customer appointments, delivery windows, vehicle scheduling and the number of jobs a driver can complete during a shift.
The accompanying survey of 1,000 van drivers who regularly use the M25, conducted by Opinion Matters, illustrates the commercial consequences.
| Business impact reported by van drivers | Percentage |
|---|---|
| Say the M25 causes delays | 81% |
| Report additional fuel costs | 29% |
| Experience late deliveries or collections | 28% |
| Have declined jobs because journeys are too unpredictable | 25% |
| Say their business could not operate as effectively without the M25 | 84% |
Source: Geotab research and Opinion Matters survey of regular M25-using van drivers.
The findings underline the motorway’s importance to the regional economy. Although 97% of surveyed van drivers in South East England consider the M25 important to their daily business operations, many also report growing frustration with its reliability.
For companies reviewing their cost of running a van, it is worth considering how delays affect fuel use, working hours and operational productivity alongside the vehicle’s direct running costs. Vehicle choice can also influence running costs, making it worth comparing the most fuel-efficient vans for the type of work and journeys a business regularly undertakes.
Morning And Evening Peaks Create Different Challenges
The survey also revealed a difference between the sections drivers perceive as the most problematic and those identified by Geotab’s traffic analysis.
Drivers most frequently identified sections around Junctions 2 to 5 clockwise and Junctions 27 to 29 anticlockwise as particularly troublesome. However, none of these six directional sections ranked among the motorway’s worst overall performers in Geotab’s analysis.
Instead, the common factor was the morning rush hour. All six experienced their slowest working-day journeys at 7am.
Geotab’s connected-vehicle data also indicated that 6am was the busiest hour for the vehicles analysed, with average speeds of 57.7 mph. Speeds fell at 7am before recovering through the middle of the day, reaching their lowest average levels between 4pm and 5pm. Businesses should also ensure drivers understand the rules that apply to their vehicles, as some vans have different speed limits from cars. CVC’s guide to UK speed limit rules for vans explains the limits that van drivers need to know.
This distinction is important for businesses scheduling drivers around customer commitments. The most frustrating stretch of motorway for a driver is not necessarily the section with the poorest overall performance, and conditions can change considerably throughout the day.
Where operational requirements allow, businesses may benefit from reviewing departure times, allowing additional time for peak-period journeys and using live traffic information to identify disruption before it affects the rest of the working day.
Journey Reliability Should Be Part Of Fleet Planning
The research also identified recurring periods of significant disruption. Across the sampled data, Geotab recorded 659 instances when speeds on a section fell to 70% or less of its normal level, including 236 disruptions lasting at least two hours.
Disruptions were concentrated around weekday peaks, with Monday and Friday recording the highest numbers.
For businesses operating several vehicles, repeated delays can make it harder to coordinate schedules, allocate vehicles and maintain reliable customer service. These challenges can be particularly relevant to businesses covering large geographical areas or undertaking several appointments and deliveries each day.
Effective fleet management solutions can help businesses take a broader view of vehicle use, operating requirements and scheduling. Reviewing how vehicles are used in practice can also help managers assess whether their current fleet is appropriate for the distances travelled, the work undertaken and the demands placed on drivers. Reviewing vehicle requirements over time can also help businesses plan replacements around changing workloads, mileage and operational demands. CVC’s guide to fleet lifecycle management explains the wider considerations involved in managing vehicles throughout their working life.
Vehicle selection is another consideration. Businesses should assess payload, load capacity, fuel efficiency, annual mileage and the type of journeys vehicles regularly undertake when deciding which models best suit their requirements. Understanding van payload is particularly important for operators carrying equipment, materials or goods, as the vehicle must be suitable for its intended workload.
For companies considering replacement vehicles, business van leasing provides an option to review vehicle requirements against a defined contract period and mileage allowance. However, choosing a different vehicle will not remove congestion, and any financial benefits depend on the business’s individual circumstances. Businesses assessing their options can also use CVC’s guide to choosing the right business van to lease to consider vehicle suitability against their operational requirements.
What Improvements Do Van Drivers Want?
The survey asked van drivers which changes they believed would make the greatest difference to their experience of using the M25.
No single proposal attracted overwhelming support. Instead, responses pointed towards a combination of better incident management, traffic information and targeted improvements to the road network.
| Proposed improvement | Share of respondents |
|---|---|
| Faster incident detection and clearance | 11.7% |
| Consistent 50 mph peak-time speed limit | 11.4% |
| Better coordination of roadworks | 11.3% |
| Better live traffic and routing information | 10.9% |
| Additional lanes on the worst-affected sections | 10.2% |
| Junction upgrades | 9.8% |
| Consistent 60 mph peak-time speed limit | 9.2% |
| Improved service areas | 9.1% |
| More reliable journey-time forecasts | 8.4% |
| Improved charging infrastructure | 7.9% |
Source: Geotab and Opinion Matters survey. Percentages represent the share selecting each proposed improvement.
The results suggest that drivers are looking for practical changes that could improve day-to-day reliability, rather than relying exclusively on major infrastructure projects.
Faster incident clearance and better coordination of roadworks could help reduce disruption, while more reliable journey-time information would allow businesses to make better-informed scheduling decisions.
Geotab’s analysis similarly points towards the western M25 as an area requiring particular attention, given the concentration of both congestion and unreliable journey times between Junctions 10 and 20.
 Call our expert team on